Power BI- Mobile Sales Analysis Dashboard
Project Details
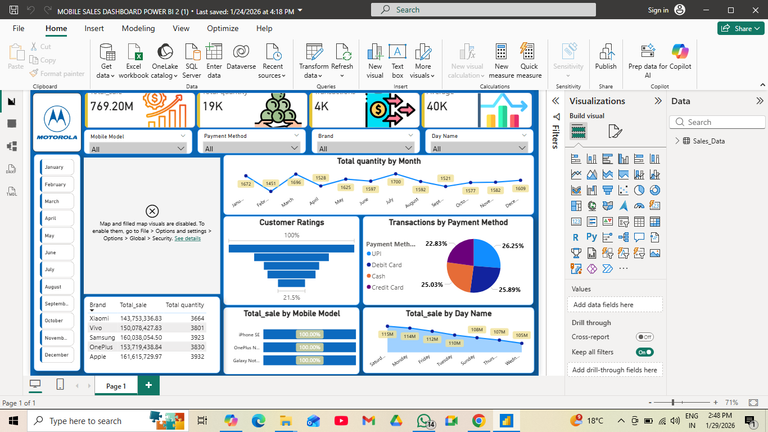
This project delivers a Power BI dashboard to analyze mobile phone sales performance. It tracks total sales, transactions, and quantities while comparing revenue across brands like Apple, Samsung, Vivo, Xiaomi, and OnePlus. The dashboard highlights customer ratings, payment method preferences, and time-based sales trends by month and day. Built using Power BI Desktop, Power Query, DAX, and SQL/Excel data sources, it provides actionable insights for sales managers and marketing teams to optimize strategies, identify top-performing models, and enhance customer satisfaction.
Skills
Tools
📱 Mobile Sales Dashboard – Power BI Project
In the fast-paced mobile industry, understanding sales performance and customer behavior is critical. Our Mobile Sales Dashboard, built with Power BI, provides a powerful, interactive view of mobile phone sales, transactions, and customer ratings. It transforms raw sales data into actionable insights that help businesses make smarter decisions.
🔍 Key Features
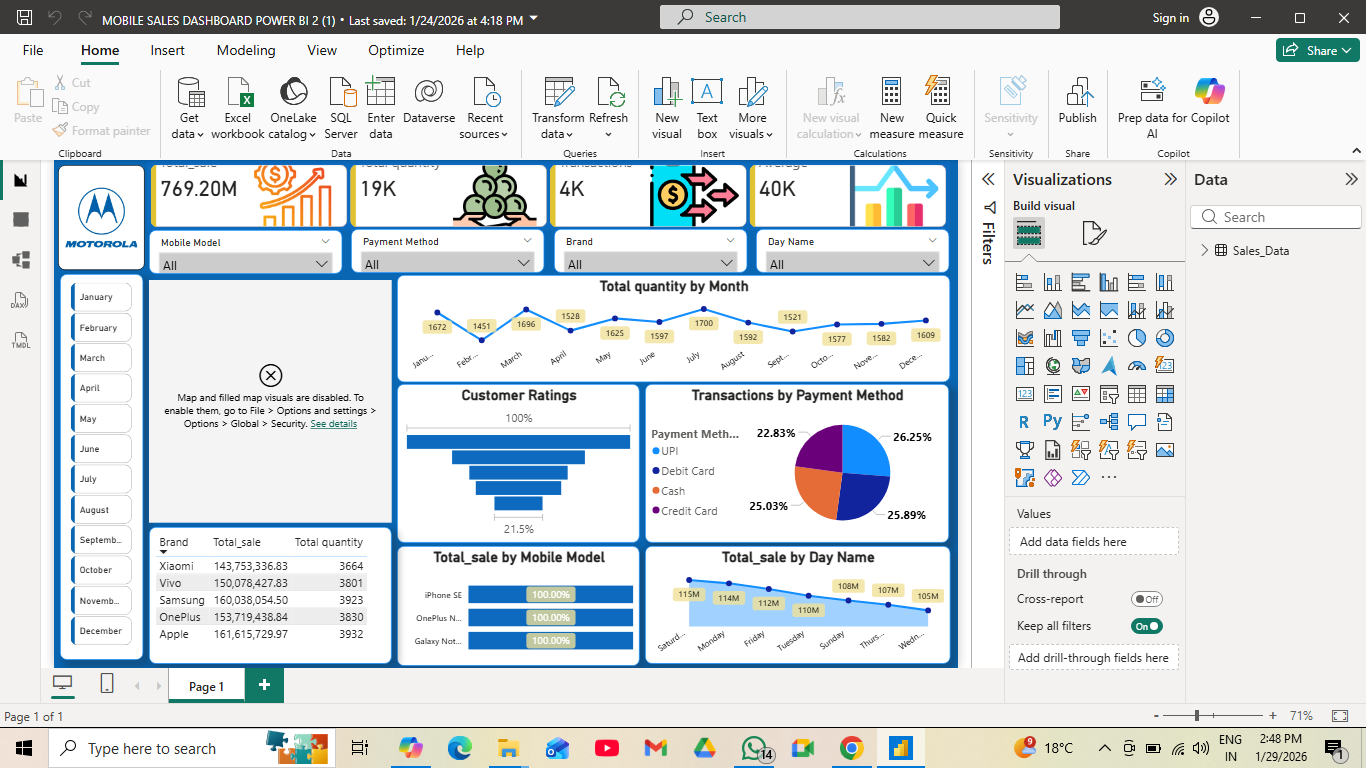
- Sales Performance Tracking – Monitor total sales, average sales, and transaction volumes.
- Brand Comparison – Evaluate revenue and quantity sold across top brands like Apple, Samsung, Vivo, Xiaomi, and OnePlus.
- Customer Ratings Funnel – Visualize satisfaction levels to identify areas for improvement.
- Payment Method Analysis – Understand customer preferences across UPI, debit card, credit card, and cash.
- Time-Based Trends – Explore sales by month and day of the week to spot peak periods.
- Model-Level Insights – Drill down into specific mobile models to see which products drive the most revenue.
🛠 Tools & Technologies
- Power BI Desktop – Dashboard creation and visualization.
- Power Query – Data cleaning and transformation.
- DAX (Data Analysis Expressions) – Custom KPIs and measures.
- Excel / SQL Database – Data sources for sales and transactions.
- Power BI Service – Publishing and sharing dashboards with stakeholders.
🌟 Business Impact This dashboard empowers sales and marketing teams to:
- Identify top-performing brands and models.
- Optimize payment method strategies based on customer preferences.
- Align promotions with peak sales days and months.
- Enhance customer experience by tracking ratings and feedback trends.
👥 Target Audience
- Sales Managers
- Marketing Teams
- Business Analysts
- Retail Executives
By combining data visualization, analytics, and storytelling, this project delivers a complete view of mobile sales performance, helping organizations stay ahead in a competitive market.
Next Project
